Greater Manchester Activity Levels Nov 19-20: Ethnicity
A detailed breakdown of the latest Active Lives research from Sport England exploring the differences in activity levels by ethnicity across Greater Manchester.
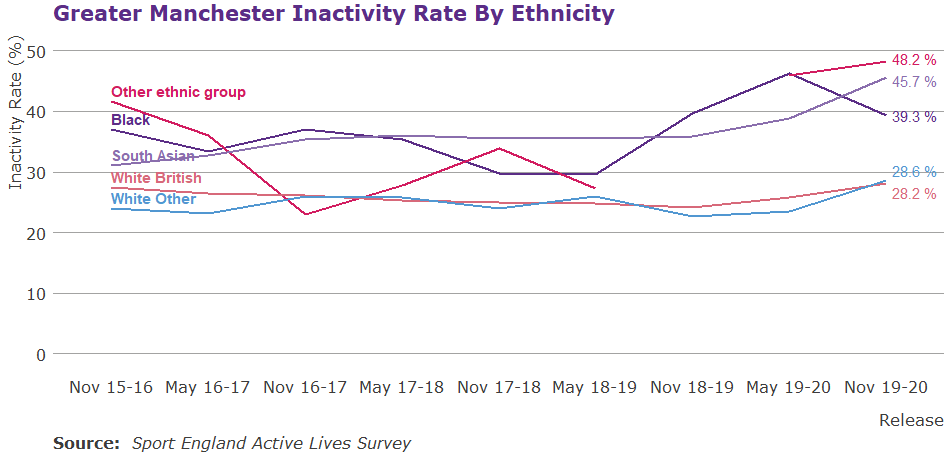
Since baseline, November 15-16, South Asians have seen the greatest increase in inactivity (+14.5%). Whilst this has been a steady increase, the last 12 months have seen a much faster increase in inactivity with rates rising 9.8% in this time. Other Ethnic Groups have had the second largest increase (+6.6%), however there has been greater fluctuation in their inactivity rates over time; in November 2016/17 they had lowest levels of inactivity. However, those identifying as Chinese or Mixed are the only two groups to see a decline in inactivity since baseline with 5.1% and 8.7% decreases respectively. Unfortunately both of these cohorts lack a full time-series dataset so the pattern over time is more challenging to understand and therefore are not included on the below graph.

Ethnicity and Other Factors
We know that numerous factors intersect and compound the differences we see in activity levels amongst different cohorts. As such it is important to not look at demographics in isolation, however, due to small sample sizes it is often not possible to compare across a range of ethnicities, as such we have only included those for which comparisons are possible.
Disability
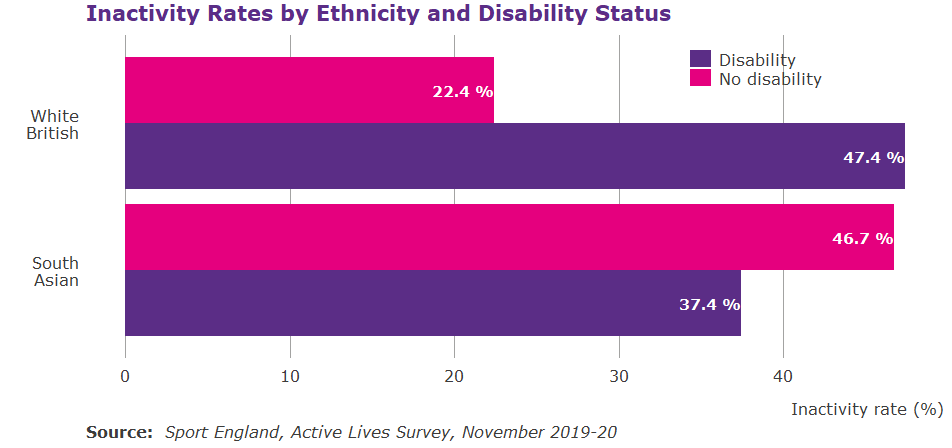
Whilst the disability gap for Greater Manchester as a whole is 19.4% the gap rises to 25.0% amongst those from a White British background. However, amongst South Asians the gap is 9.3% and those with a disability are more likely to be active; this is an uncommon relationship with disability normally being a key indicator for inactivity and we are unclear as to why this pattern is seen here.

Gender
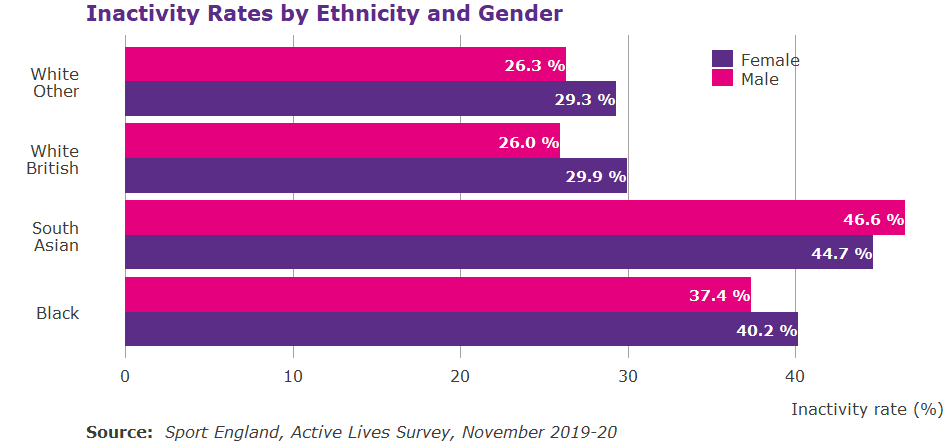
Generally female inactivity is higher than male inactivity, however, this is not always the case with some areas and demographics seeing the opposite; this is seen amongst the South Asian community where inactivity is 1.9% higher amongst men. It is worth noting that South Asians see the smallest gender gap but highest levels of inactivity for both men and women, 46.6% and 44.7% respectively.

Age
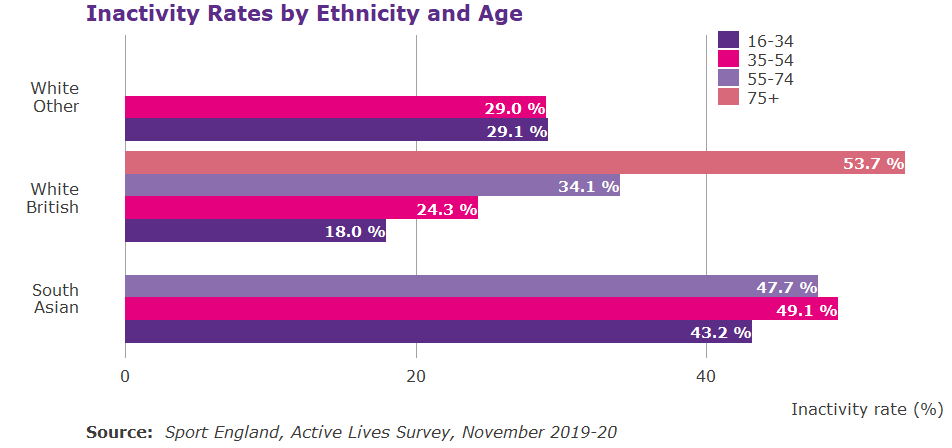
Whilst we typically see inactivity increase consistently with age, as seen amongst those from a White British background, this is not always the case. Whilst there is incomplete data amongst both White Other and South Asian communities the pattern is not as clear. White Other sees inactivity remain consistent across both 16 to 34 year olds and 35 to 54 year olds. Meanwhile, amongst South Asians inactivity is slightly lower in the 55 to 74 age group compared to 35 to 54 year olds. However, this cohort does have much higher inactivity to start with, with 16 to 34 year olds having an inactivity rate nearly 2.5 times greater than their White British peers.

Find out more about the relationship between ethnicity and physical activity here.
More information on the latest Active Lives release can be found here.
If you have questions about this data please email: [email protected]
All data is rounded to one decimal point.
Published June 2021
