Greater Manchester
Changes in adult activity levels across Greater Manchester over time since the Sport England Active Lives survey began in November 2015-16

Adult Active Lives in Context
Sport England’s Active Lives survey provides us with essential insight into activity habits, however, the numbers alone can’t tell us why change has happened and each release is a snapshot of a one year time period. As such we are going to bring together local intelligence and insight in an attempt to understand the changes we see. Whilst we may not be able to say for sure that a specific programme or event has reduced inactivity we hope that this will provide some context to the data and tell the story of physical activity levels in Greater Manchester (GM) from November 2015-16 to November 2022-23.
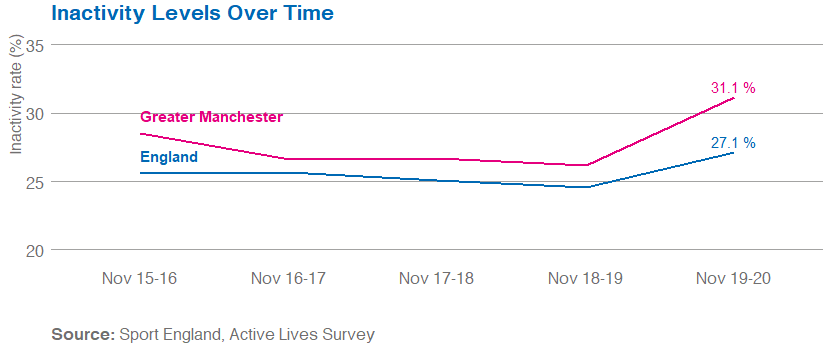
The Active Lives Survey started data collection in November 2015, after the first year of data collection inactivity, the proportion of adults who are active for less than 30 minutes a week, in Greater Manchester stood at 28.5%. Between year 1 (Nov 2015-16) and year 2 (Nov 2016-17) of the survey, inactivity remained steady nationally, whilst in Greater Manchester rates were declining with the percentage of people who were active increasing significantly. Over the following two years, November 2017-18 and November 2018-19, inactivity rates in Greater Manchester remained relatively similar to the inactivity levels in November 2016-17. However, in November 2019-20 inactivity increased significantly both nationally and in Greater Manchester; we know that these overall increases were driven by spikes in inactivity during 2020 coinciding with the emergence of the Covid-19 pandemic.
Possible Influences on Activity in Greater Manchester
Over this five-year period (November 2015-20) there have been significant changes in the system which has supported the promotion of physical activity and potentially impacted upon inactivity rates. Prior to the launch of the Active Lives Survey the Greater Manchester Moving blueprint was launched which brought together senior leaders around the shared purpose of tackling inactivity.
February 2016 saw the launch of the Greater Manchester Physical Activity and Sport Commissioning Pilot with Sport England and the signing of the Memorandum of Understanding which marked the first step in the new approach to increasing physical activity in Greater Manchester.
During the years when inactivity remained stable, from November 2016-17 to November 2018-19, a number of steps were taken across Greater Manchester to support the physical activity agenda, these included;
- Physical activity being included in the Greater Manchester Population Health Plan and Greater Manchester Mayoral Manifesto.
- The GM Walking and Cycling Commissioner being appointed.
- Greater Manchester being confirmed as a Local Delivery Pilot by Sport England.
Collectively these actions represent significant steps forward in the prioritisation of physical activity at a system level - learn more about them here. These actions also enabled the system to work together to support those with the highest rates of inactivity and at greatest risk of inactivity.
With the Covid-19 pandemic in 2020/21 significantly disrupting daily life, plans were quickly implemented in an attempt to minimise the impact on physical activity habits. This included the launch of Keep GM Moving in March 2020 and the development of the GM Moving for GM Recovery Plan in May 2020. These were introduced once it became clear how great the impact of lockdowns and restrictions would be. Whilst inactivity significantly increased during this time this work, and work by others both locally and nationally, has potentially lessened the increase in inactivity that was seen.
Demographic changes
Different population demographics see different changes in activity levels over time. Explore more about these changes below.
Age

For the youngest age group, 16-34, inactivity remained steady between November 2015-16 and November 2017-18, however, since then inactivity has risen steadily and in November 2019-20 peaked at 25.2%, 5.4% higher than when the survey began.
35-54 year olds also saw relatively little change in inactivity during the first four years of the survey (-2.2%), however, since then inactivity has risen 4.4%, resulting once more in inactivity at a greater rate than when Active Lives began.
Over 75s are the only age group to see inactivity remain below the November 2015-16 baseline (-2.0%). Despite a small increase in inactivity between year 1 and year 2 of the survey (November 2015-16 and November 2016-17) the inactivity levels amongst over 75s then fell consistently to November 2018-19 when inactivity was 7.8% below the November 2016-17 high. However, in light of the Covid-19 pandemic, inactivity has increased once more amongst this age group with a 4.6% rise in inactivity between November 2018-19 to November 2019-20.
Meanwhile, 55-74 year olds saw inactivity fall steadily from November 2015-16 to November 2018-19 (-2.2%). However, they too were also negatively impacted by the pandemic with inactivity increasing by 6.7% in just 12 months.
The steady decreases in activity for 55-74 year olds and Over 75s seen before the pandemic could be linked to the promotion of Active Ageing across Greater Manchester; in 2017, the Greater Manchester Age Friendly Strategy and the commitment to be the ‘UK’s first Age-Friendly City Region’, were both launched. Due to people within these age groups being more likely to need to shield during the pandemic, resources were created to support older adults to remain active at home. This could have potentially mitigated against a more substantial increase in inactivity amongst over 55s during this time.
Disability

Inactivity amongst those with a long-term limiting disability has steadily declined since the launch of Active Lives (November 2015-16). During this time, national and local programmes and campaigns were launched to promote activity for those with disabilities and long-term health conditions to help reduce their high levels of inactivity; Get Out Get Active (2016), We Are Undefeatable (2019) and That Counts! (2019). Inactivity amongst those with no long-term limiting disability remained relatively stable up until the Covid-19 pandemic, between November 2018-19 and November 2019-20 inactivity rose by 5.0% compared to 2.9% among those with a long-term limiting disability.
Gender

Since November 2015-16 inactivity for both men and women was in a steady rate of decline with inactivity amongst women falling around 25% faster than men, with both having record lows in November 2018-19. In 2015, Sport England launched the nationwide campaign, This Girl Can to encourage women and girls to move more, in whatever way works for them. However, with the profound changes in daily lives caused by Covid-19 pandemic inactivity amongst both saw a significant increase, with both male and female inactivity peaking in November 2019-20 at 29.7% and 32.0% respectively. Both male and female inactivity levels are now higher than when the survey began, +2.9% and +2% respectively.
Socio-economic status

Inactivity amongst higher social groups (NS-SEC 1-2) has seen relatively little change since Active Lives began, peaking at 19.8% (November 2019-20) and a low of 17.8% (November 2017-18). A similar pattern was also seen amongst middle social groups (NS-SEC 3-5) up until November 2018-19, inactivity then began to rise, coinciding with the Covid-19 pandemic. Lower social groups (NS-SEC 6-8) however, have seen greater fluctuations with November 2018-19 seeing an inactivity low of 33.5%. Since then inactivity soared by 10.4% between November 2018-19 and November 2019-20. In September 2019, the That Counts! campaign launched for which lower social groups were a target audience.
Ethnicity

Those from Black backgrounds have seen large fluctuations in inactivity levels, with inactivity increasing by 9.9% between Nov 2017-18 and Nov 2018-19.
Amongst South Asians inactivity plateaued between November 2016-17 and November 2018-19 but has subsequently increased by 9.8%, most likely linked to the Covid-19 crisis which has disproportionately affected those from a South Asian background.
Inactivity amongst White British and White Other has remained relatively steady over time however both recorded their highest rates in November 2019-20 (28.2% and 28.6%) this is 4.1% and 5.9% above the lowest recorded rates (November 2018-19) and coincides with the Covid-19 pandemic.
Due to limited sample sizes we do not have data at every time-point for all ethnicities, as such making it harder to understand the patterns seen amongst these cohorts, as such they are not included on the above graph.
Amongst those from a Chinese background inactivity has fallen by 5.1% between November 2015-16 and November 2019-20. Meanwhile, amongst those identifying as Mixed sees large degrees of fluctuations with a low of 18.0% in November 2019-20 and a high of 28.3% in November 2018-19. Other ethnic groups have seen the greatest fluctuations with inactivity falling by 18.6% between year 1 and 2 of the survey before rising once more in year 3. Whilst the dataset is incomplete inactivity hit highs of 48.2% in November 2019-20.