Greater Manchester Activity Levels Nov 18-19: Ethnicity
A detailed breakdown of the latest Active Lives research into the difference in activity levels across ethnicities in Greater Manchester.
A number of inactivity inequality gaps exist and whilst they may have narrowed, to varying degrees, across Greater Manchester (GM) we can still see clear gender, age, disability, socio-economic status and ethnicity gaps. Many of these factors overlap and further compound the differences.
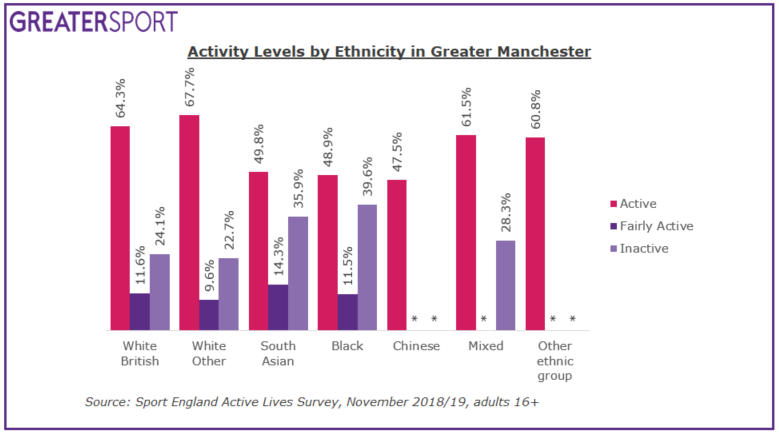
In the latest Active Lives release the activity levels vary clearly across ethnicities with the inactive population in Greater Manchester varying from 22.7% amongst those from a White Other background to 39.6% for those from a Black background. When comparing White British to non-White British backgrounds the inactivity gap is clear; 24.1% of those with White British background are inactive compared to 32.1% amongst those from all other backgrounds.
Ethnicity: A breakdown
When inactivity is broken down further, more differences are highlighted. Three quarters (75.1%) of those from a South Asian background who are inactive do no physical activity, in comparison amongst White British people this is 55.8%; this equates to 27.0% of the whole South Asian population in GM doing no physical activity at all. Those from a Black background also see a worryingly high proportion of the total population doing no physical activity (26.5%) in comparison amongst White British and White Other the proportion is much lower which 13.4% and 13.0% respectively doing no physical activity.

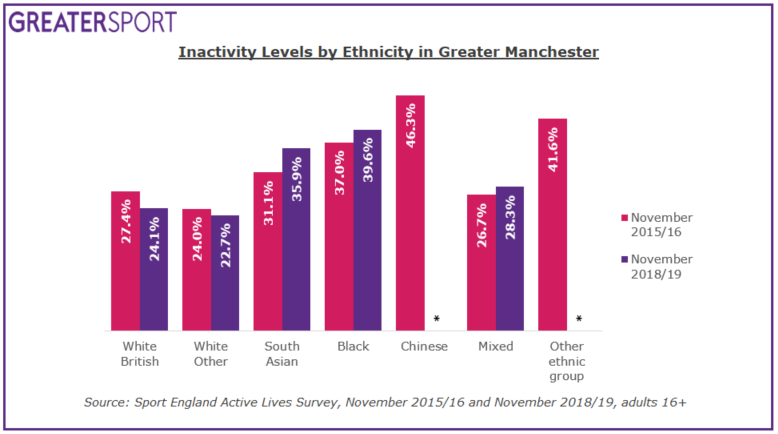
Since baseline (November 2015/16) inactivity levels have changed noticeably across the demographics with White British and White Other both seeing a decrease in inactivity, 3.3% and 1.3% respectively. What is concerning is that South Asian, Black and Mixed backgrounds have all seen inactivity levels move in the wrong direction; amongst South Asians inactivity has risen by 4.8%, amongst those from a Black background 2.6% and Mixed backgrounds 1.6%.

Ethnicity and other factors
When looking at both ethnicity and gender, the largest gender inactivity gap is amongst those from a Black background with a 5.9% gap, with females most inactive. Interestingly the smallest gender gap is amongst those from a South Asian background with a 0.4% gap. However, when looking across ethnicities the highest inactivity levels are amongst men from a South Asian background (35.8%) and South Asian women have the second highest inactivity levels.
More information on the latest Active Lives release can be found here.
If you want to find out more about engaging people from Black, Asian and Minority Ethnic backgrounds in physical activity, take a look at Sporting Equals’ website. Find out more about the relationship between ethnicity and physical activity levels here.
